Butterfly Pattern: Here's How To Spot And Trade This Powerful Pattern
In this post, we’re going to learn how to spot and trade the Butterfly pattern.
There are several interpretations of the Butterfly structure. Much like the Gartley pattern and the initial interpretation of the Gartley pattern, there are many variations and many different structures that are considered a Butterfly.
The pattern was first discovered by Bryce Gilmore and he outlined the exact ratio alignment requirements for all pattern points to define the “ideal” structure.
Butterfly Pattern Definition
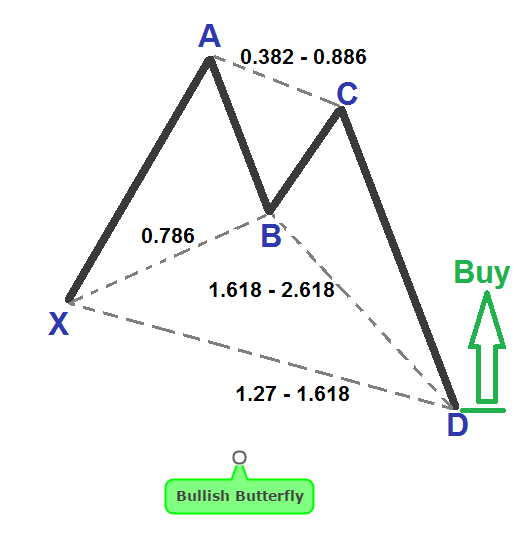
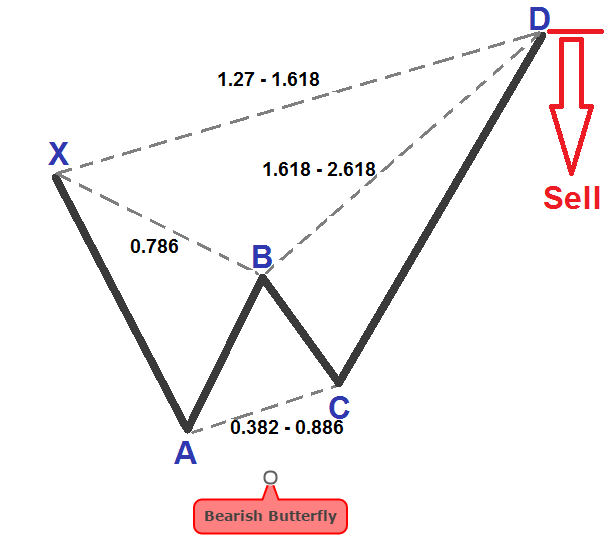
Unlike the Gartley pattern, the Butterfly pattern offers the possibility to enter long/short at new lows/highs because point D of the pattern could extend beyond the starting point of the XA wave.
The B point is the most important in this pattern because it defines the structure and sets up the other measurements within the pattern. The AB leg must represent precisely 78.6% retracement of the XA swing.
Next, in the BC leg, the price must retrace 38.2% to 88.6% of the previous AB leg.
Finally, the CD leg should represent 127% to 161% extension of the XA leg. And the pattern also requires an AB = CD symmetrical structure to be valid.
If you want to look for a perfect pattern, then point D of the pattern should also be 161% to 261% extension of the BC leg.
How to trade Butterfly pattern
The optimal entry point is at 1.618 extension of the AB leg using a protective stop loss 10 pips above/below the 2.618 extension, and with a profit target at 61.8% Fibonacci retracement of CD leg.
However, we also suggest that you should scale down your position and take partial profit once we hit 38.2% Fibonacci retracement.
Bearish Butterfly - Short Setup
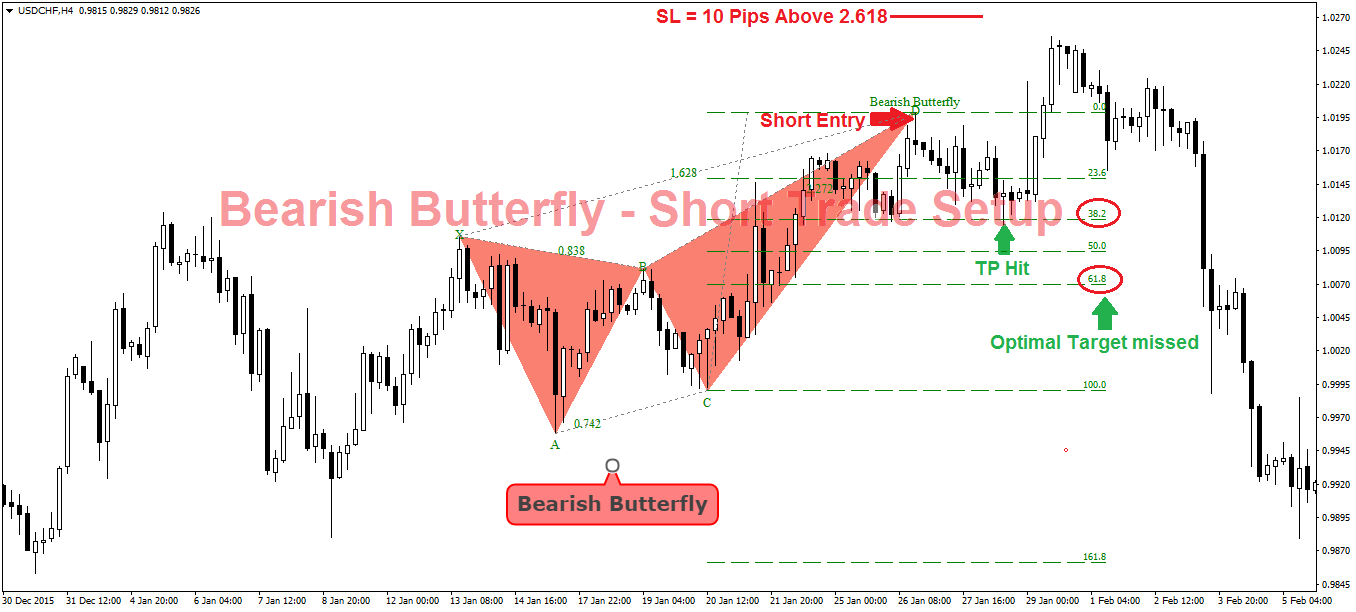
This example shows you a imperfect bearish Butterfly pattern with the CD leg ending slightly above the 1.618 extension of the XA leg.
Also, the BC leg doesn’t exceed the 88.6% retracement of AB. However, the AB leg falls short of reaching the 78.6% retracement of the XA leg which as stated above is of crucial importance when it comes to defining the structure of the Butterfly pattern.
Our optimal target of 61.8% Fibonnaci
retracement of the CD leg was missed as the price only slightly
broke below the 38.2%. At this 38.2% level, we should have begun
scaling down from our position.
Bullish Butterfly - Long Setup
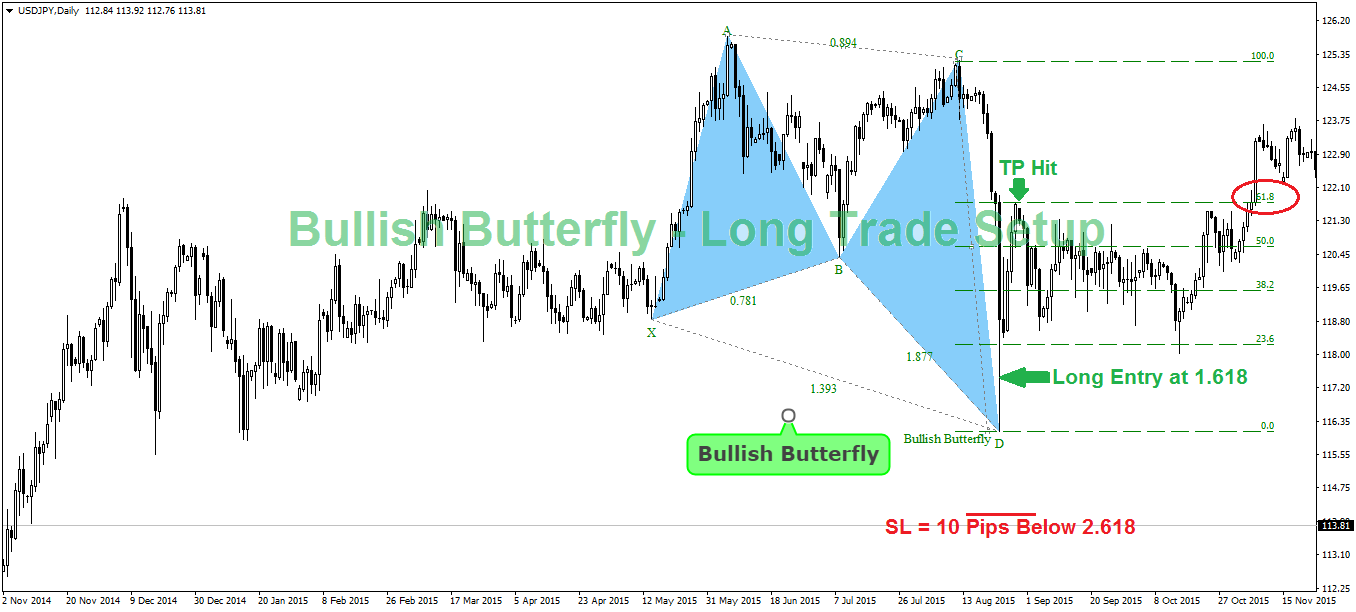
In this example, notice how AB retraced almost exactly 78.6% of XA. And because of this, this pattern has a much higher probability of winning. Our profit target of 61.8% retracement of the CD leg was hit not long after the trade is triggered.
And another cool characteristic of the Butterfly pattern is that...
In some cases, this pattern could correctly predict the start of a new major trend...
Take a look at this example:
If we zoom out, we'll see that this Butterfly
pattern marks the end of the previous downtrend and could be the
very beginning of a new uptrend: