New "Day Trading Dashboard" Indicator Scans ALL Pairs and ALL Time-frames For The Most Accurate Day Trading Patterns Ever (At Least From Our Rigorous Test)..."
A rare combination of new trading concept and breakthrough mathematical technology. The dashboard scans and displays all of the best day trading patterns on 1 easy-to-use dashboard:
"Day Trading Dashboard" detects high-probability trade setups based on price action ONLY. Reacts to changes in market condition very fast, so you can capture the best trade opportunities.
Shows you the most accurate patterns based on breakouts and consolidation zones.
You no longer need to manually scan for these patterns on every pair and time-frame. The dashboard does all the hard work for you.
With just one look at the dashboard, you'll instantly know which day trading pattern has just formed on every pair and every time-frame (from 1-minute to monthly)...
Hi there,
I get it.
You love the thrill of day trading. And the profit it could bring. And you love the instant reward: You could enter a trade and exit it within a few hours, and see the gains almost immediately.
But day trading also means the roller coaster of excitement and fear. And on top of that, the biggest problem of day trading is that -- it's almost impossible to reliably identify high-probability trades when you're dealing with the intraday time frames and the associated noise & whipsaw.
I remember when I first got started day-trading, there was so many false signals and noise... most of the time I would get stopped out almost as soon as I entered a position.
I got sick of it.
So I embarked on a journey to find a new approach to profitable day trading.
And I think I did it.
Here's the full scoop:
Based on Donchian breakouts and price patterns, our all-new "Day Trading Dashboard" indicator is the most accurate trading tool I know of for scalping and day trading the intraday charts (especially 30-minute and 1-hour time frame).
And because it uses purely price action to spot these trade setups (our unique algorithm doesn't use ANY lagging indicator at all for pattern detection), it reacts to the market very fast.
That way, you can be sure you get in a potentially profitable trade as early as possible... and as such, you would be able to extract as much profit as you can out of any intraday price movement.
But not only that...
You don't even need to open each symbol, each time frame separately to find these patterns. The "Day Trading Dashboard" indicator does all the heavy lifting.
It scans every single pair and every single time frame for these high-probability day trading patterns. And displays all detected patterns on an easy-to-use dashboard. So you can know instantly when a pattern shows up.
Let's see this indicator in action:
Let's look more closely to really understand how the indicator works:

First we have this beautiful dashboard that display all the patterns that have
just formed on ALL pairs and ALL time frames.
Second, the latest formed pattern is highlighted on your chart with an arrow that indicates the pattern's direction.
Also shown on your chart is the Maximum Favortable Excursion metric of the previous pattern. That simply means, the most profit that could have been extracted from the previous pattern.
The first thing you need to know about Day Trading Dashboard is that..
"Day Trading Dashboard" Indicator Works Extremely Well For Scalping On 30-Minute Time Frame...
Let's take a look at the latest formed pattern on the 30-minute time frame on 3 major pairs: EUR/USD, GBP/USD, and USD/JPY:
See how well the Day Trading dashboard indicator detects
trade opportunities for scalping the 30-minute charts?
As you can see, our Day Trading Dashboard indicator works exceedingly well at identifying trade setups for scalping the intraday time frames.
Plus... because it's based on price action only, it reacts to market changes very fast. That way, you'd be the first to get in when a trade opportunity presents itself.
But that's not all. It keeps getting better...
The Indicator Works Extremely Well For Day Trading On 1-Hour Time Frame...
Let's analyze how these patterns perform on the 1-hour time frame (using these 4 pairs as example: AUD/USD, USD/CAD, USD/CHF, and USD/JPY)

If the Day Trading Dashboard indicator detected these
patterns and handed them to you, do you think you'd be able to profit from these clear trade
setups?
But that's not all...
The "Day Trading Dashboard" Is Even More Powerful On 4-Hour Charts...
In my opinion, the 4-hour time frame is the sweet point: It has less noise, but still offers you a lot of trading opportunities.
Let's see how the Day Trading Dashboard works on this time frame:
But maybe what surprises me the most is...
How Well The "Day Trading Dashboard" Work On The Daily Time Frame...
Although it's originally developed for day trading, it turns out that these patterns are also very effective on the daily time frame.
Take a look at these examples to see how good they really are:
And by the way...
"Day Trading Dashboard" Indicator Is Perfect For Detecting Breakouts...
Did you know that Day Trading Dashboard indicator also identifies true breakouts with great accuracy?
Here's a case study on USD/JPY 4-hour chart:
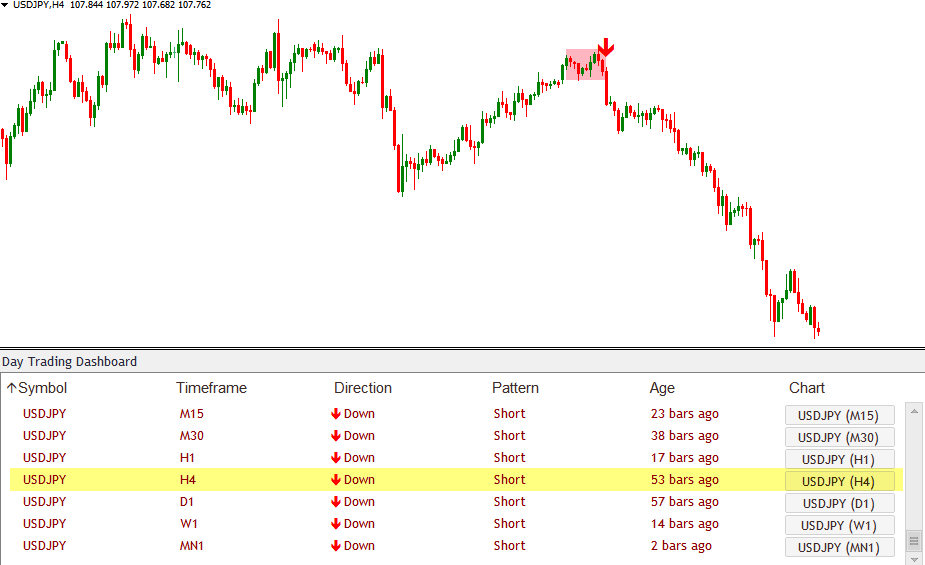
In this case, did you notice that after a long consolidation, the Day Trading Dashboard indicator accurately detects
a legitimate breakout to the downside? This pattern is indeed
followed by large market move downward.
But maybe this is the most interesting part of all:
Day Trading Dashboard Indicator Is The Best Tool I've Seen For Catching Tops And Bottoms...
No, it's not the Holy Grail, nor the magic bullet. But it's pretty darn good at catching tops and bottoms.
Let me show you an example where the Day Trading Dashboard managed to catch the end of the previous trend (and the beginning of a new trend) on USD/CAD and AUD/USD:
And if you've read this far, I think you've already noticed this particularly
useful feature of the Day Trading Dashboard:
Click on the symbol you want, and the indicator will open up that symbol chart with the day trading pattern highlighted...
That way, you can look at the dashboard first to see the overall picture
across multiple time-frames. Then once you identify a pattern that you want to
trade, just click on the symbol to open up the relevant chart, so you can
analyze the pattern further.
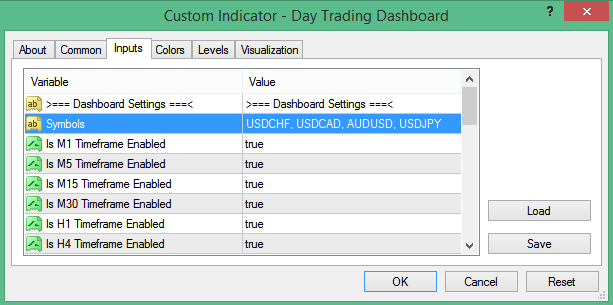
And you can specify which currency pairs and which time-frames you want the indicator to scan for day trading patterns.
You can specify as many pairs as you like. You can also use it for indices, stocks, futures, and gold (anything your broker offers in Metatrader). Our Day Trading Dashboard will take care of it all.
And by the way, did you know that...
You can sort the dashboard in any way you like -- based on Symbol, Timeframe, Direction, or Age...
Let me show you exactly how it works:
But Hang On... We're Not Done...
Further down this page, you'll notice there are TWO purchase options you can choose. You can get Day Trading Dashboard indicator alone for an insanely generous price I'm giving the first 200.
Or... you can invest a little more and get the Dashboard Pro package.
So What's Inside The "Dashboard Pro" Package?
First off, you get the Day Trading Dashboard indicator. And on top of that, you'll also get access to the ENTIRE collection of ALL of our flagship DASHBOARD indicators. Including Divergence Dashboard, Harmonic Dashboard, Wolfe Wave Dashboard, Reversal Dashboard, Candlestick Dashboard, and more.
To see the full list of all indicators included in the Dashboard Pro package, click here...
And here's where it gets even better:
If you grab Day Trading Dashboard TODAY, you'll also get a BIG BONUS:
BIG BONUS: Logic Day Trading Indicator
A perfect companion to Day Trading Dashboard. The Logic Day Trading indicator is perfect for you if you'd like to identify all of the highest-probability day trading opportunities on a single currency pair.
Fast, lightweight, and efficient. This indicator will automatically detect all day trading setups for you.
Retail price: $99. But today you'll get it free when you invest in the Day Trading Dashboard indicator.
Special offer: Get Day Trading Dashboard for $229
Dashboard Pro - Lifetime Membership
one-time payment
- Get ALL dashboard indicators.
- Lifetime updates and new indicators
- All features included. Works perfectly on Metatrader 4
- Unlimited license: Use the indicators on as many computers as you like.
Dashboard Pro - One-Year Membership
one-time payment
- Get ALL dashboard indicators.
- 1 year free of updates and new indicators
- All features included. Works perfectly on Metatrader 4
- Unlimited license: Use the indicators on as many computers as you like.
Day Trading Dashboard
one-time payment
- Get Day Trading Dashboard.
- Platform: Metatrader 4.
- Unlimited license: Use the indicator on as many computers as you like.
We use SSL secure connection on our website. The information you send is always encrypted and secure.

Technical details:
- This indicator works on Metatrader 4
- You'll get free updates and upgrades whenever we'll release a new version.
- You can use the indicator on ANY instrument your Metatrader 4 offers: FX pairs, Gold, Silver, Indices, Futures, Stocks...
See you inside the members' area,
Frank
P.S. Have questions? Click the "Chat" blue button on the bottom right corner of this page. We're here to help!