Hi there,
Let's go back to the beginning:
3 months ago, I released the Dual Divergence indicator. And it quickly became our best-selling indicator.
For good reasons:
Dual Divergence is probably the most accurate indicator for predicting trend reversals
The easiest way to explain how it works is showing you an example of Dual Divergence in action:
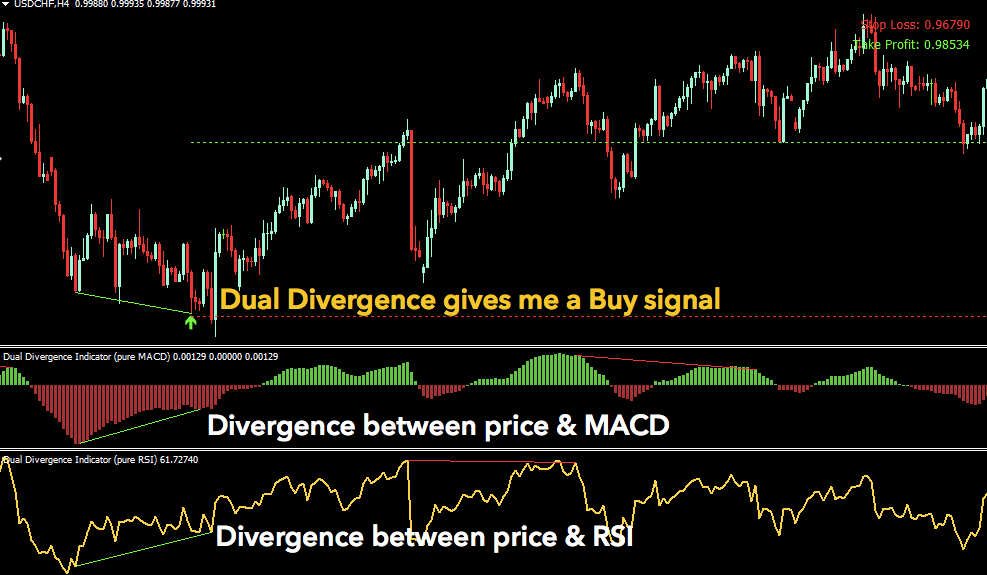
In this example, on USD/CHF 4-hour timeframe, there's a bullish divergence between the price & MACD. And there's also a bullish divergence between the price & RSI.
Therefore, the Dual Divergence indicator gives me a Buy signal.
Which quickly leads to a winning trade.
In essence, that's exactly what the Dual Divergence indicator is designed to do:
It gives you a Buy/Sell signal when there's a divergence between price & RSI... and... a divergence between price & MACD, both happening at the same time.
Let me explain why this feature is so important:
Everybody knows that: Divergence is one of the most time-tested & proven strategy for trading reversals.
The best part is -- divergence is UNIVERSAL. It works in MANY markets across ALL timeframes. In other words, many professionals consider divergence as THE standard method for trading reversals.
But here's the problem with divergence:
An obvious part of trying to pick tops and bottoms is that... you get a lot of false signals.
And that's the problem we want to solve with the Dual Divergence indicator: Eliminating a large percentage of false signals.
And the way the Dual Divergence indicator gets rid of false signals is ingenious.
It only gives a signal when a divergence occurs between price and (not one) but TWO oscillators. More specifically, when there's a divergence between price & MACD... and... there's a divergence between price & RSI, happening at the same time, the indicator gives you a timely alert.
Here's an example to illustrate what I mean:
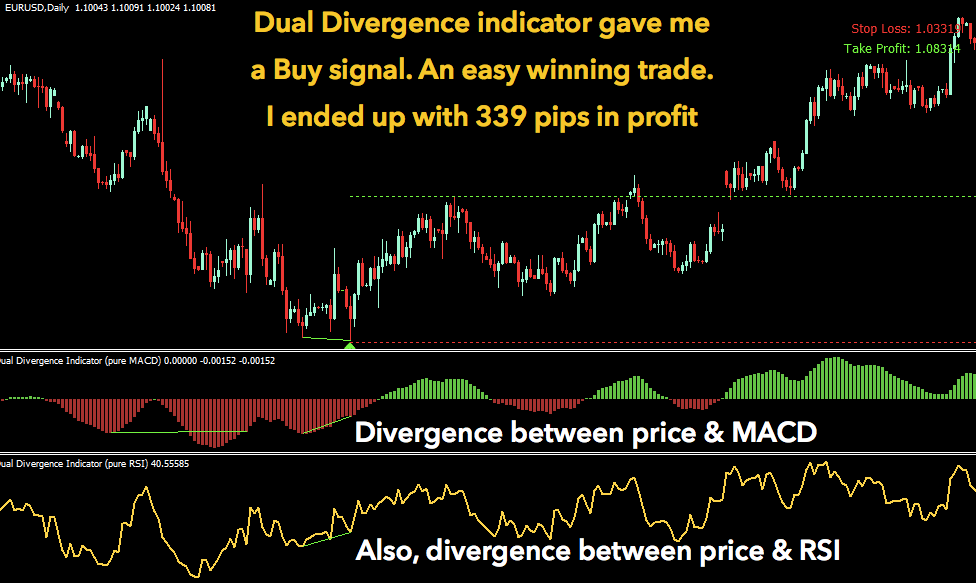
In this example, on EUR/USD daily timeframe, a divergence between price & MACD... and... a divergence between price & RSI occurred at roughly the same time.
Therefore, the Dual Divergence indicator gave me a Buy signal. The price quickly moved in my favor. And I ended up with 339 pips in profit.
Here's where it gets even better:
If I were more patient and stayed in the trade a little longer, I would have gotten a much larger amount of profits. Why? Because it turns out that this divergence marks the beginning of a new, big uptrend.
So... if I were able to ride this trend until the end, I would have made a maximum of 2,136 pips. Incredible, isn't it?
On the other hand, let me show you...
How the Dual Divergence indicator helps me stay out of bad trades...
Take a look at this chart:
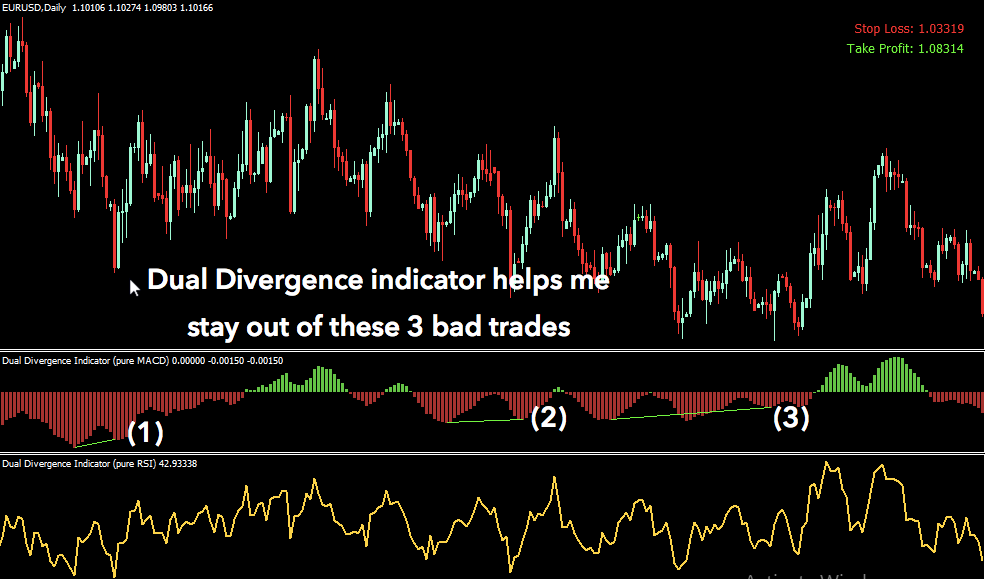
Pay attention to the areas where I marked (1), (2), (3). In these instances, a divergence occurred between price & MACD. But, there was no divergence between price & RSI.
And so, these are lower-probability trade setups. The Dual Divergence didn't issue a signal in this case, and helped me stayed out of these 3 bad trades.
By the way...
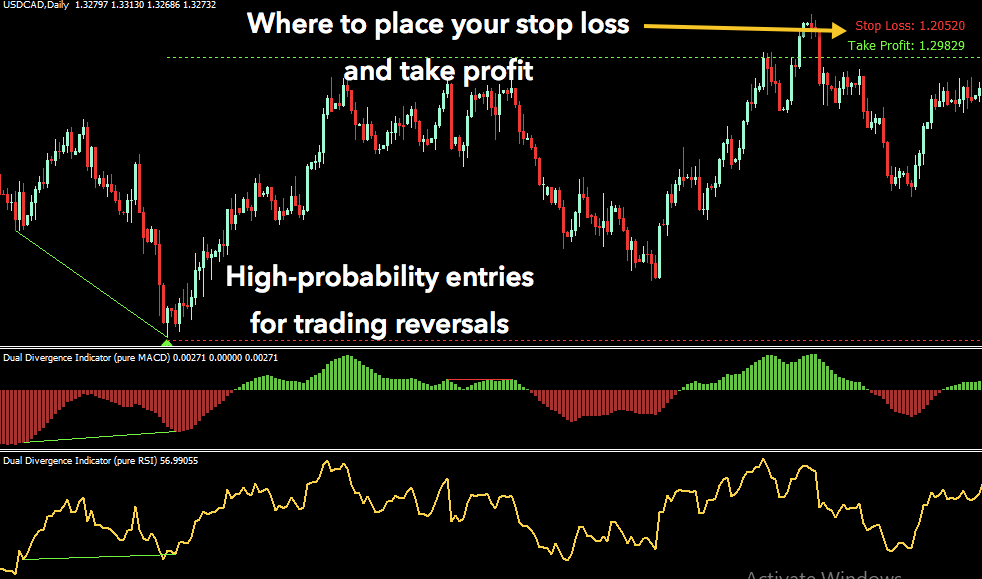
Once a trade entry is triggered, the Dual Divergence indicator will also show you...
The best place to place your stop loss and take profit.
In other words, Dual Divergence gives you EVERYTHING on a silver platter: High-probability trade entry, stop loss, take profit...
It does all of the hard work for you. You no longer have to guess when to enter or where to set your stop loss & take profit. Everything's taken care of. You don't have to lift a finger.
Anyhow, did you notice that...
The default settings for our stop loss and take profit ALWAYS ensure that the Reward:Risk ratio of EVERY trade is 3:1 or better.
Which means, when you lose, you'll lose only a little. But when you win, you'll win BIG.
And that also means you only need to win 34% of the time in order to make a profit!
For example, in the example above, the Reward:Risk ratio of that particular trade is actually 15:1.
That means, I risk only $1 to make $15! Simply amazing...
Here's another important point:
The Dual Divergence indicator works equally well for scalpers, day traders, and swing traders.
And it's very very easy to trade with Dual Divergence because...
The indicator gives you all kinds of alerts: Pop-up, Sound, Email, and Push Notifications as soon as a setup appears...
Plus... you're in total control. For example, you can change the color of any text, entry, stop loss & take profit.
And... you can even set how strict you want the indicator to be. For example, if you'd like to be really strict and want to identify only the highest-probability trade setups, you could easily do so. On the other hand, if you want to get more trade setups, it's also 100% possible.
In addition, the indicator is extremely flexible: Works on ANY currency pair... ANY time-frame.
It also works on indices, stocks, commodities, and futures. Virtually any instrument you could think of.
But that's not all...
Today, we're taking it to a whole new level:
So 3 months ago, we released the Dual Divergence indicator.
Out of the blue, it quickly became our best-selling product.
Among the emails we received from happy Dual Divergence customers, one stands out.
He said: "Dual Divergence works. No doubt about it. But I trade 10 currency pairs plus gold and S&P500.
Takes quite some time to go through each pair to see which trade setups have formed."
Gave me an idea.
What if we could apply our world-famous "Dashboard" concept and design to those divergence-based trade setups?
What if we could develop some kind of "Dual Divergence Dashboard" indicator that SCANS all the pairs you want to trade, on ALL time-frames for the highest-probability divergence-based trade setups?
And shows you all the recently formed trade setups in all markets, on all timeframes in ONE beautiful, easy-to-use dashboard.
I'm happy to say: I'VE DONE IT.
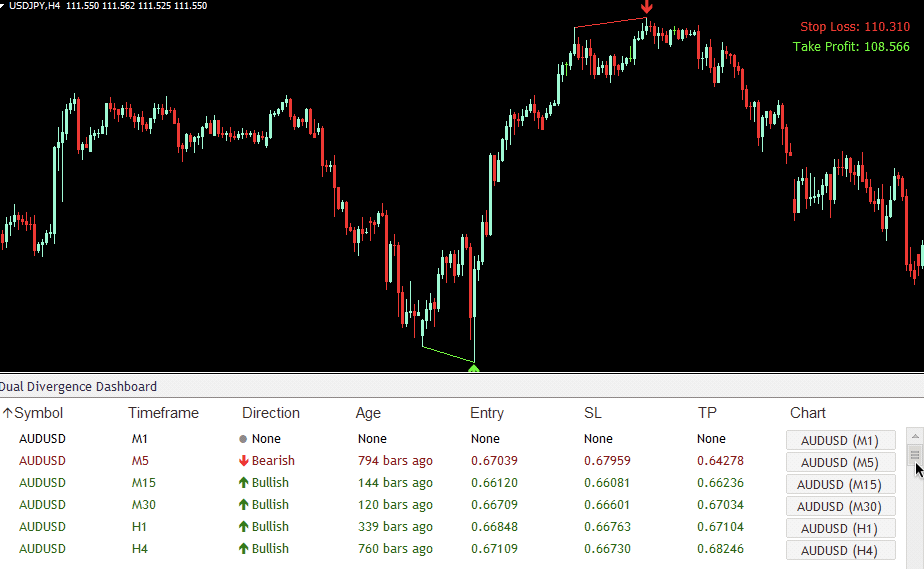
Here's a teaser: Look at the all-new Dual Divergence Dashboard in action...
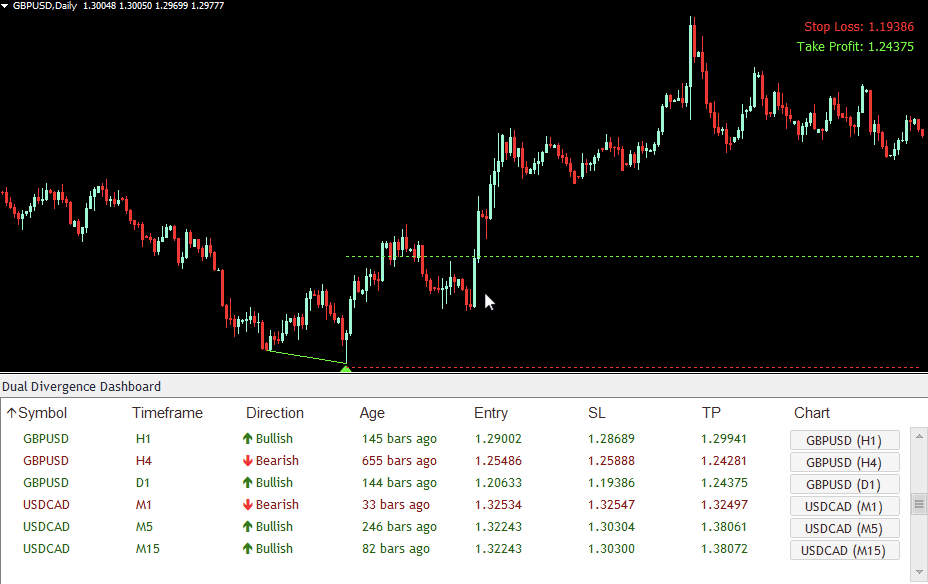
The Dual Divergence Dashboard indicator displays all detected trade setups based on our world-famous Dual Divergence concept in ONE convenient dashboard.
You no longer need to manually scan every pair and time-frame.
The dashboard does all the hard work for you.
With just one look at the dashboard, you'll instantly know
which trade setups has just formed on every pair and every
time-frame (from 1-minute to monthly)...
So...
Let our Dual Divergence Dashboard indicator do all the heavy lifting for you...
First, it will scan ALL currency pairs and ALL time-frames for the highest-probability trade setups based on our Dual Divergence concept you could ever find. And all these calculations are done so fast - literally within seconds - you won't even notice the time.
Second, the indicator will display a beautiful dashboard on your chart where you can see exactly what trade setup has recently formed on EVERY pair, EVERY time-frame.
Take a look below to see how cool it really is:
With just one look at the dashboard, you'll instantly know all the information you need to make a good trading decision. You'll instantly know which trade setup appears on every time-frame (from 1-minute to monthly) and on every currency pair.
Not only that, you'll also know the exact direction of that pattern - whether it's bullish or bearish. And you'll know exactly how long ago that particular setup showed up.
And you're in total control. You can specify which currency pairs and which time-frame you want the indicator to scan for these divergence trade setups:
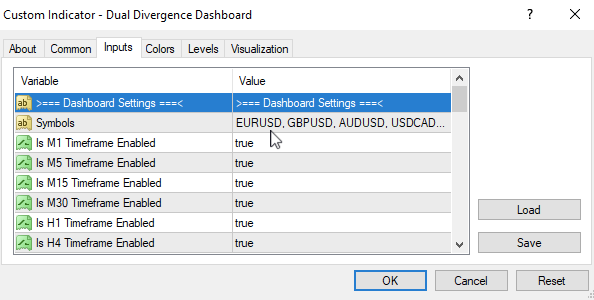
Remember, you can specify as many pairs as you like. You can also use it for indices, stocks, futures, and gold (anything your broker offers in Metatrader). Our Dual Divergence Dashboard takes care of it all.
Let me show you a short clip where I scroll through 10 currency pairs (and all time-frames from 1-minute to monthly) and see all of the divergence-based trade setups in my dashboard:
But maybe the most useful feature of the Divergence Dashboard indicator is...
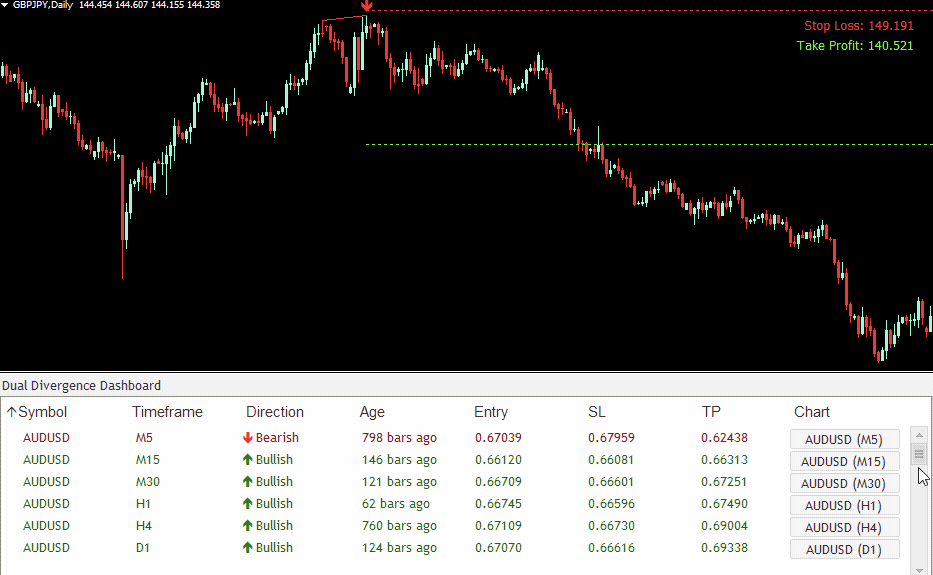
Click on the symbol you want, and the indicator will open up that symbol's chart with the divergence trade setup highlighted...
Take a look at this short clip to see what I mean:

That way, you can look at the dashboard first to see the overall picture across multiple time-frames. Then once you identify a pattern that you want to trade, just click on the symbol to open up the relevant chart, so you can analyze the pattern further.
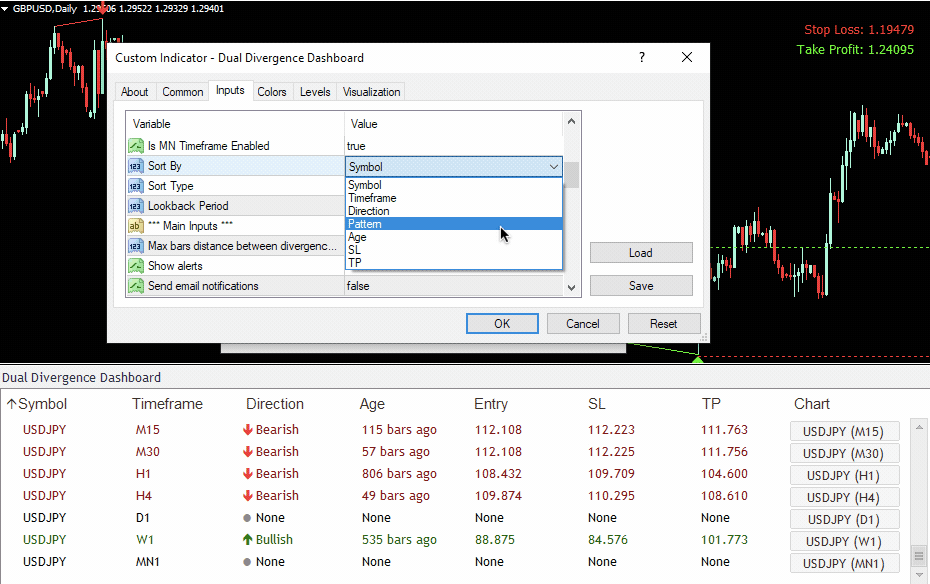
And by the way, did you know that...
You can sort the dashboard in any way you like -- based on Symbol, Timeframe, Direction, or Age...
Let me show you exactly how it works:
Pretty cool, isn't it?
By the way, it's very, very easy to trade with Dual Divergence Dashboard indicator because...
The indicator gives you all kinds of alerts: Pop-up, Sound, Email, and Push Notifications as soon as a pattern appears...
So you'll never miss out on another important trade.
And my favorite part about Dual Divergence Dashboard is that...
Since dual divergence is a UNIVERSAL trading concept, and it works on ANY timeframe and ANY currency pair (any financial instrument for that matter)...
The Dual Divergence Dashboard indicator works equally well for day traders, swing traders, and long-term traders...
But Hang On... We're Not Done...
Further down this page, you'll notice there are TWO purchase options you can choose. You can get Dual Divergence Dashboard indicator alone for an insanely generous price I'm giving the first 25.
Or... you can invest a little more and get the Dashboard Pro package.
So What's Inside The "Dashboard Pro" Package?
First off, you get the Dual Divergence Dashboard indicator. And on top of that, you'll also get access to the ENTIRE collection of ALL of our flagship DASHBOARD indicators. Including Harmonic Dashboard, Day Trading Dashboard, Wolfe Wave Dashboard, Divergence Dashboard, Candlestick Dashboard, and more.
To see the full list of all indicators included in the Dashboard Pro package, click here...
And here's where it gets even better:
If you grab Dual Divergence Dashboard TODAY, you'll also get an EXCLUSIVE BONUS:
Big Bonus: Our Dual Divergence indicator - the predecessor of the Dual Divergence Dashboard, so to speak.
A perfect companion to Dual Divergence Dashboard. The Dual Divergence indicator is perfect for you if you'd like to identify all the best "dual-divergence" trade setups on a single currency pair.
Fast, lightweight, and efficient. This indicator will automatically detect all instances of dual divergence for you.
And it will also show you the exact entry price, and suggest an ideal place to set your stop loss and take profit.
Retail price: $129. But today you'll get it free when you invest in Dual Divergence Dashboard.
Buy Now:
Dashboard Pro - Lifetime Membership
$1220
one-time payment
- Get ALL dashboard indicators.
- Lifetime updates and new indicators
- All features included. Works perfectly on Metatrader 4
- Unlimited license: Use the indicators on as many computers as you like.
Dashboard Pro - One-Year Membership
$720
one-time payment
- Get ALL dashboard indicators.
- 1 year free of updates and new indicators
- All features included. Works perfectly on Metatrader 4
- Unlimited license: Use the indicators on as many computers as you like.
Single Indicator
$229
one-time payment
- Get Dual Divergence Dashboard only.
- All features included. Works perfectly on Metatrader 4.
- Unlimited license: Use the indicator on as many computers as you like.
Click here if the button above doesn't work
We use SSL secure connection on our website.
The information you send is always encrypted and secure.

Technical details:
- This indicator works on Metatrader 4
- Current version: 1.0
- This is a one-time payment, NOT a subscription.
- Your license includes 1 year of updates and support. After one
year, you can purchase an update & support plan to continue to
receive support & updates (not compulsory)
- You can use the indicator on ANY instrument your Metatrader 4 offers: FX pairs, Gold, Silver, Indices, Futures, Stocks...
- Please remember: There are no refunds and all sales are final.
Good trading,
Frank