If you're a trend trader, this is what you've been looking for...
New "Hidden Divergence Dashboard" Indicator Scans All Pairs and All Timeframes for the Highest-Probability Trend Following Setups Based on HIDDEN Divergence...
Using this dashboard is super easy, and it could help you find winning trend-following trades in 5 minutes or less. As close as it gets to a complete, AUTOMATED trading solution: The indicator shows you accurate entries and exactly where to place your stop loss and take profit.
Hi there,
Let's go back to the beginning:
2 months ago, I released the Hidden Divergence Pro indicator. And it
quickly became our best-selling indicator.
For good reasons:
Hidden Divergence Pro is probably the best trend-following & pullback trading indicator ever developed.
Here's the secret behind this amazing indicator:
For the first time, we've successfully combined one of the most time-tested trading strategies of all time AND our unique trading insight & algorithm to create this
ULTIMATE trading machine.
Let me explain:
For decades, professional traders have been successfully using a setup called Hidden Divergence to trade in direction with the current trend.
And with Hidden Divergence Pro, we're finally leveling the playing field. And we're giving you a professional tool that AUTOMATICALLY detects ALL hidden divergences on ANY currency pair you'd like to trade.
We call it the "Hidden Divergence Pro" indicator.
And this amazing indicator AUTOMATICALLY detects a powerful kind of divergence called Hidden Divergence – a high-probability trade setup for trading WITH the trend.
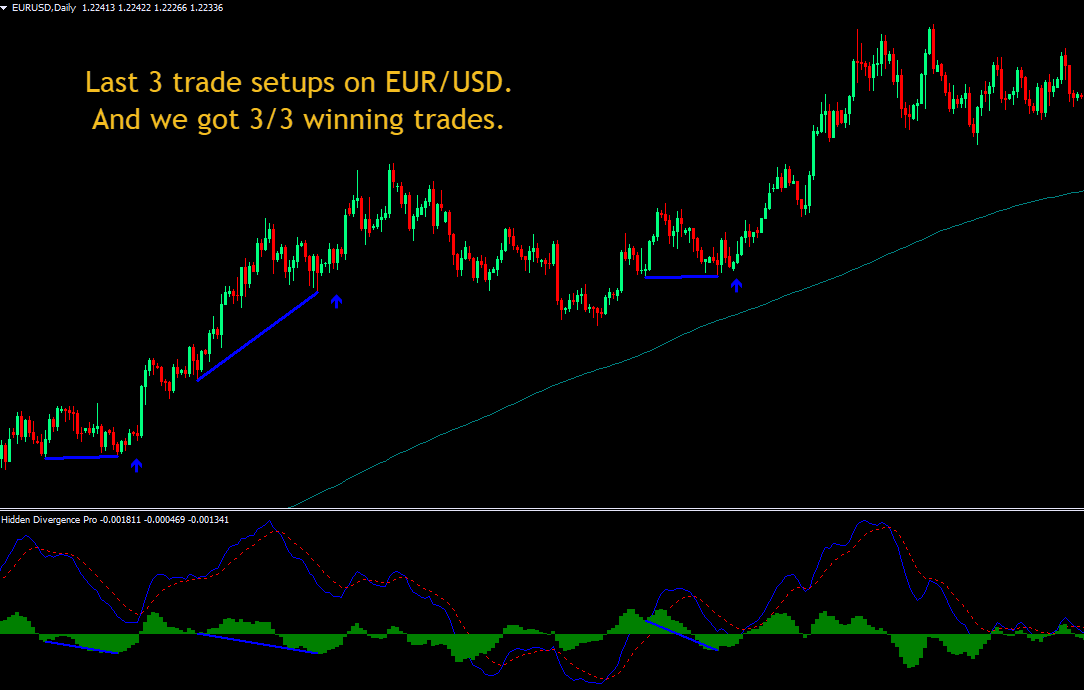
Let me show you an example of how the Hidden Divergence Pro indicator easily identifies 3 big winning trades on EUR/USD. And then I'll explain exactly how it works:
The first thing you need to know is...
What exactly is Hidden Divergence and why is it important?
If you've been trading for some time, you should already be familiar with regular divergence which many experts consider the best way to trade reversals.
Regular divergence and hidden divergence are sisters. With one BIG difference:
While regular divergence predicts potential reversals AGAINST the trend, hidden divergence is used to identify trade opportunities in direction of the main trend.
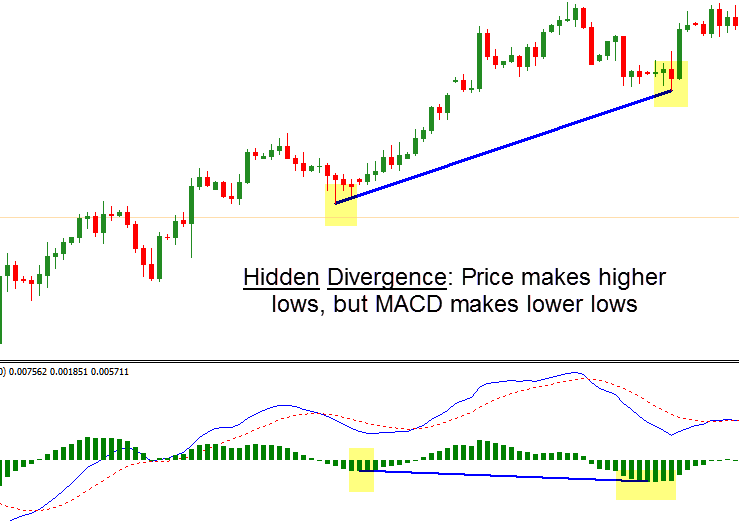
Bullish hidden divergence occurs when price makes a series of
higher lows, but the oscillator (MACD or any other oscillator like
RSI, Stochastic, etc...) makes a series of lower lows.
Vice versa, bearish hidden divergence occurs when price makes a
series of lower highs, but the indicator makes a series of higher
highs.
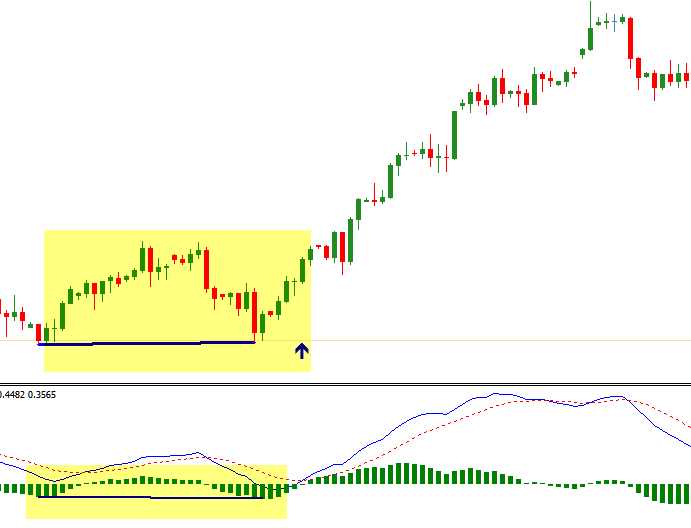
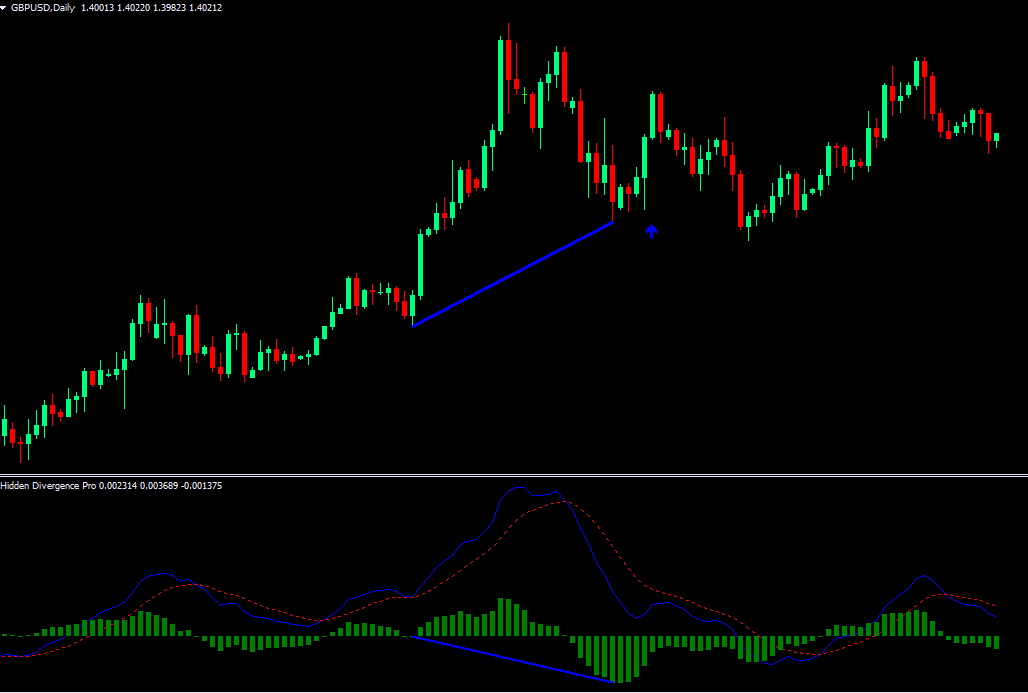
For example, here's a bullish hidden divergence on GBP/USD;
What's interesting about divergences is that:
Just as regular
divergence is considered a LEADING indicator for predicting
potential market reversals, hidden divergence, in our opinion, could
also be a LEADING indicator which alerts you ahead of time when the
trend is likely to continue.
But here's the problem:
There was no reliable indicator that can identify
those hidden divergences for you, and gives you an alert as soon as
a setup is detected.
Until now...
Introducing: Hidden Divergence Pro indicator...
Let's take a look at how it works:
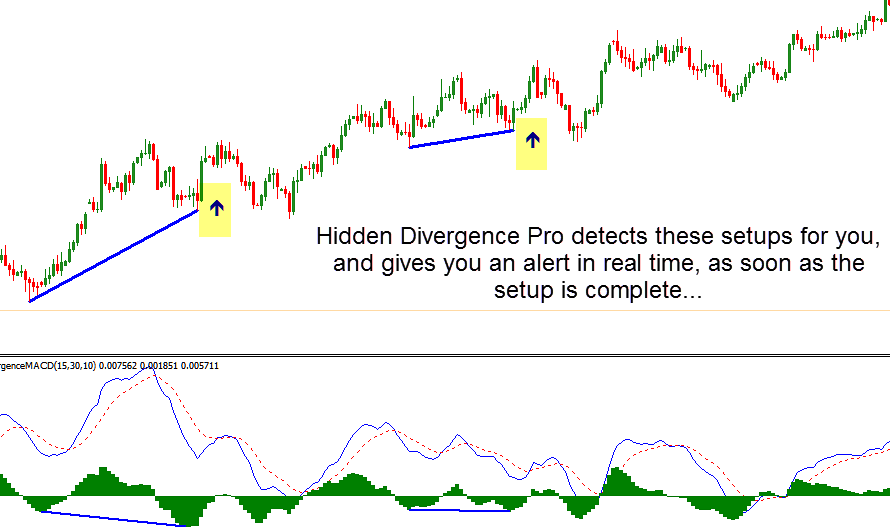
In this example, the indicator does all the hard work and detects
these 2 hidden divergences for you.
And it gives you an alert as soon as
the setup is complete.
When a hidden divergence occurs, you know
ahead of time that there's great probability price will travel
further in the direction of the trend. So you can be confident
entering the trend (and with great timing too). No more uncertainty.
No more doubt.
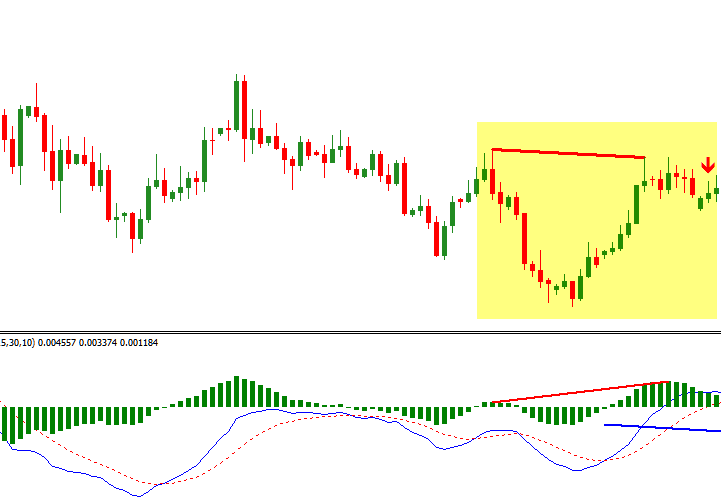
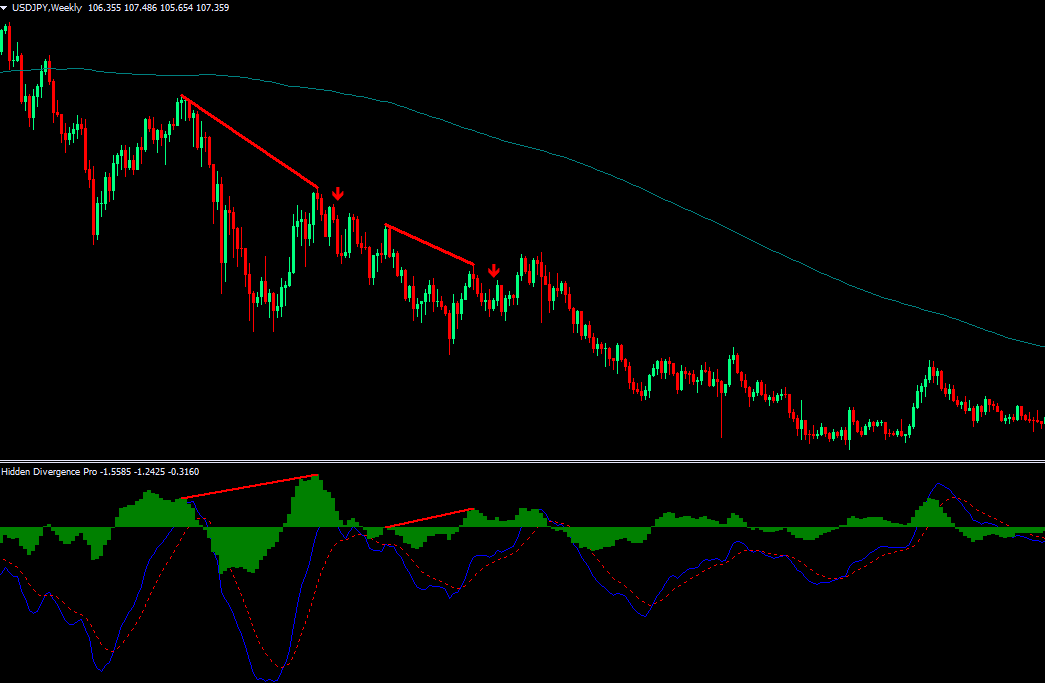
Now, let's switch our focus and take a look at a bearish hidden divergence
on the same pair GBP/USD:
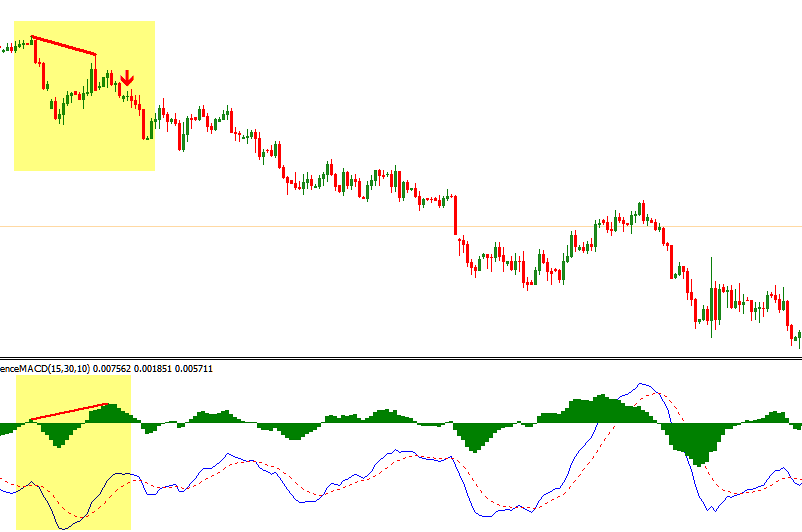
Again, the Hidden Divergence Pro indicator does almost all the hard
work and identifies this great bearish setup for you. If you decided
to take this short trade, it would be a 1,146-pip win.
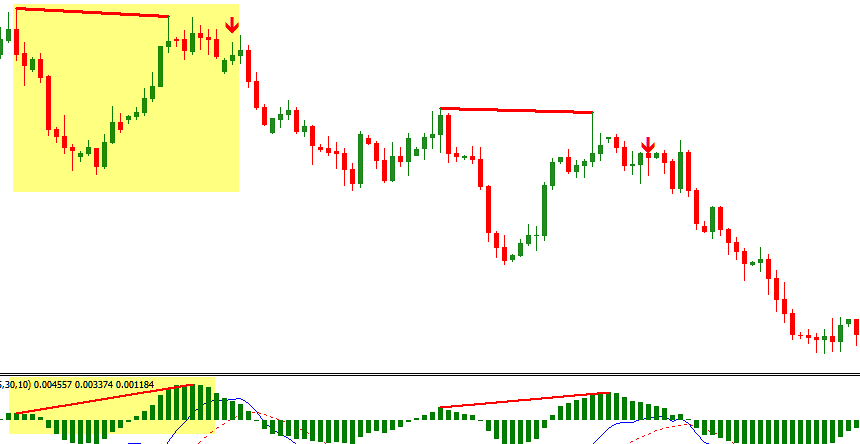
Now, let's zoom out and look at the bigger picture to see how the
indicator performed over a long period of time:
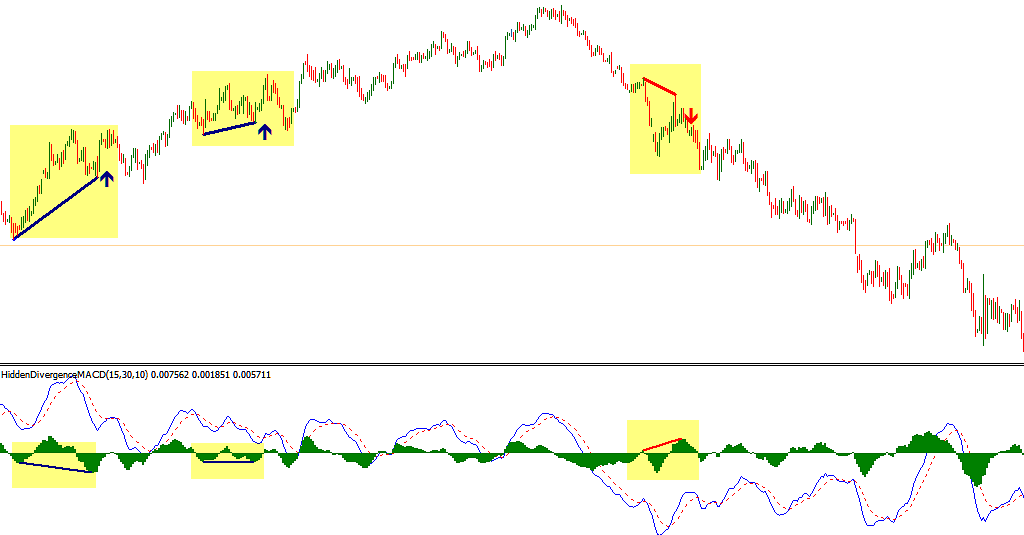
Over this time period, Hidden Divergence Pro indicator issues 3
alerts (2 bullish hidden divergences & 1 bearish hidden divergence).
All three turns out to be significant wins. And if you chose to
follow the indicator's alerts, you'd have captured most of these 2
major trends.
Now that you see how accuracy the indicator is, let me explain...
The secret behind Hidden Divergence Pro's
accuracy...
Here's exactly the secret behind Hidden Divergence's accuracy:
The indicator uses 2 unique trend direction filters to make sure it
filters out as many false signals as possible.
That way, it only alerts you when there's high probability that
the trend will likely to continue, and price will likely travel
further in the direction of the trend.
Now, let's see how well the indicator works for another
pair: USD/CAD:
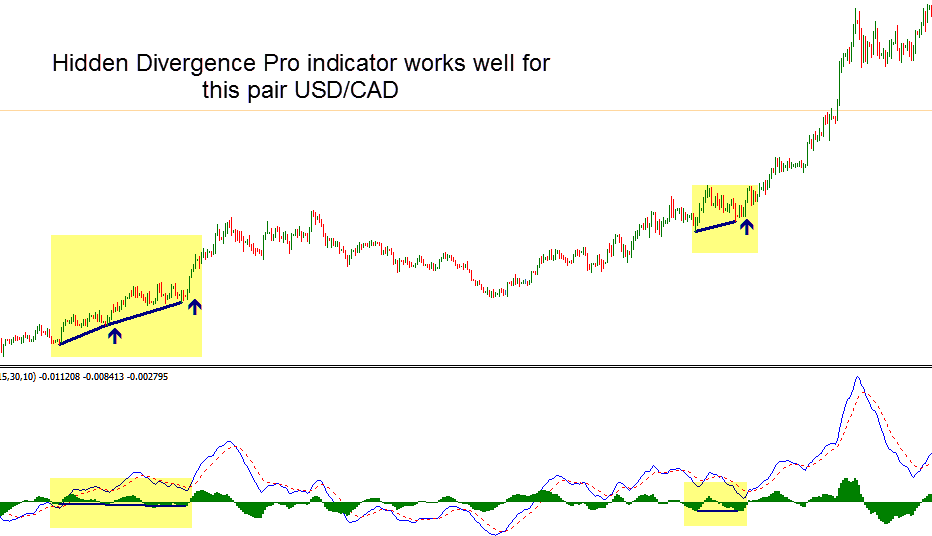
This example illustrates what could be the most important feature
of Hidden Divergence Pro:
It allows you to join the trend with great
timing, right before a big price move will likely occur.
And that means, you could be able to capture most of the trend
and (hopefully) profit from it.
Now, let's analyze another trade example, this time on EUR/JPY:
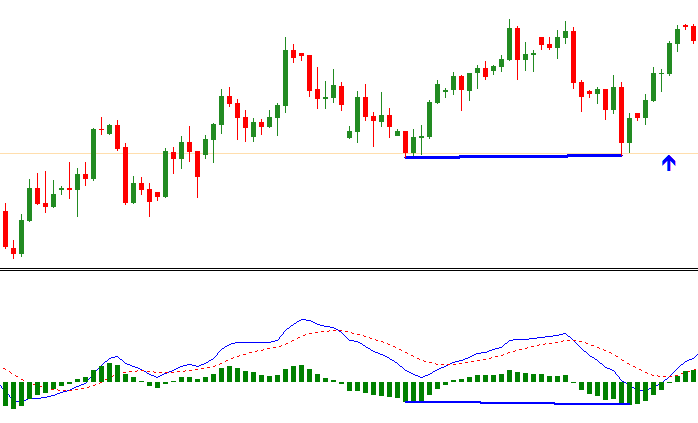
In this case, Hidden Divergence Pro indicator identifies a
bullish trade setup, and gives an alert.
This is a high-probability setup in continuation with the
underlying trend. So, if we decided to take this trade, let's see
what happens next:
Just as the indicator predicted, this bullish hidden divergence
marks the beginning of a significant price move. And if you followed
the indicator's alert, you'd have been able to profit from this
move.
Here's another example: (this time it's a bearish hidden
divergence)
As
you can see, the price in this case makes a lower high while the
indicator makes higher high. The Hidden Divergence Pro indicator
detects this setup for you, and gives you a bearish alert.
Watch
what happens next if we decide to take this trade:
Again, this bearish hidden divergence turned out to be the start of
a big downward market move.
And did you also notice that the
indicator also identifies another bearish hidden divergence? If you
decided to take both of these trades, you would have had 2 easy wins
from this market move.
Pretty cool, isn't it?
By the way, it's very, very easy to trade with Hidden Divergence Pro indicator because...
The indicator gives you all kinds of alerts:
Pop-up, Sound, Email, and Push Notifications as soon as a trade setup appears...
So you'll never miss out on another important trade.
And my favorite part about Hidden Divergence Pro is that...
Since hidden divergence is a UNIVERSAL trading concept, and it works on
ANY timeframe and ANY currency pair (any financial instrument for
that matter)...
The Hidden Divergence Pro indicator works equally well for day
traders, swing traders, and long-term traders...
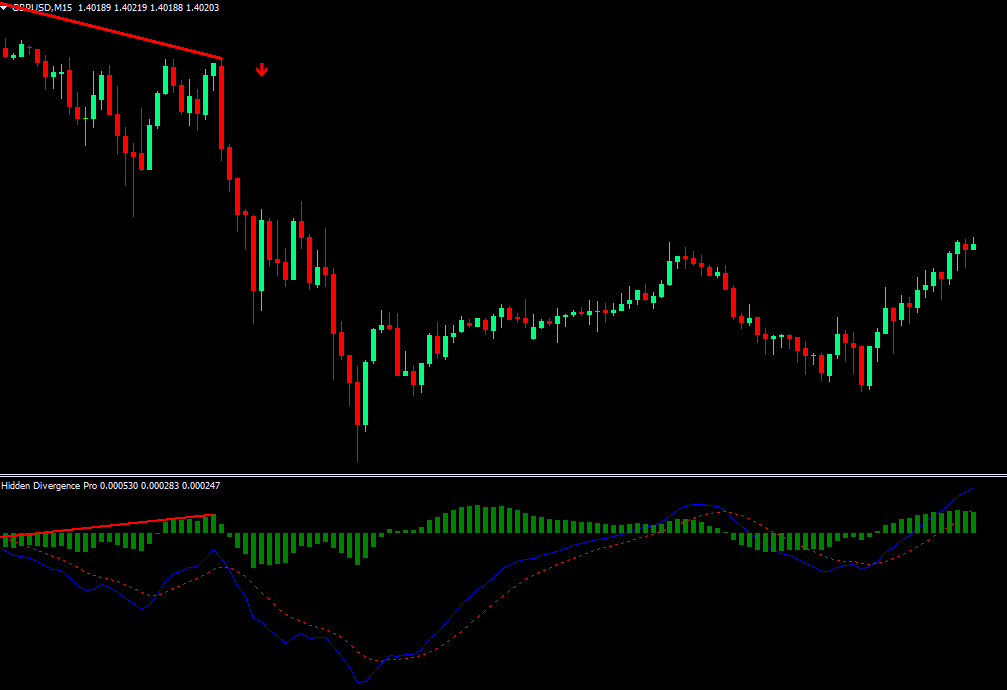
For example, if I were a day trader, I'd love this winning trade on the 15-minute timeframe:
Day Trading Example:
And if I were a swing trader, I'd love this winning trade on the daily timeframe:
Swing Trading Example:
And if I were a long-term trader, I'd love this winning trade on the weekly timeframe:
Long-Term Trading Example:
But that's not all...
Today, we're taking it to a whole new level:
So 2 months ago, we released the Hidden Divergence Pro indicator.
Out of the blue, it quickly became our best-selling product.
Among the emails we received from happy Hidden Divergence Pro customers,
one stands out.
He said: "Hidden Divergence Pro works. No doubt about it. But I trade
10 currency pairs plus gold and S&P500.
Takes quite some time to go through each pair to see which trade
setups have formed."
Gave me an idea.
What if we could apply our world-famous "Dashboard" concept and design to
those HIDDEN divergence-based trade setups?
What if we could develop some kind of "Hidden Divergence Dashboard"
indicator that SCANS all the pairs you want to trade, on ALL
time-frames for the highest-probability trade setups based on hidden divergences
And shows you all the recently formed trade setups in all markets,
on all timeframes in ONE beautiful, easy-to-use dashboard.
I'm happy to say: I'VE DONE IT.
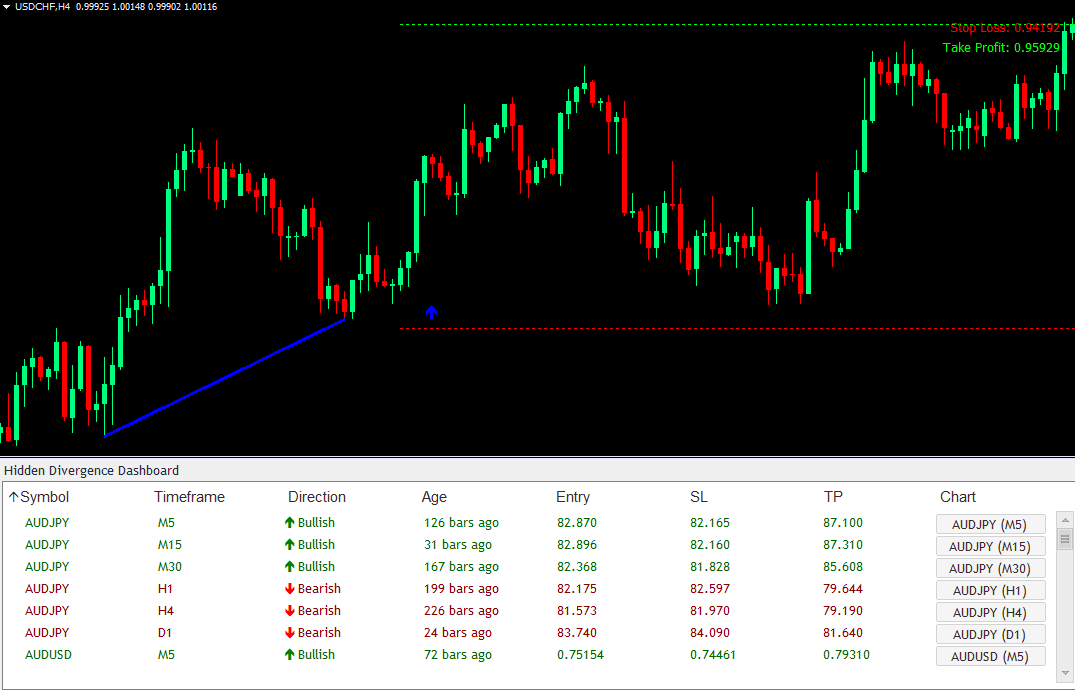
Here's a teaser: Look at the all-new Hidden Divergence Dashboard in action...
The Hidden Divergence Dashboard indicator displays all detected
trade setups based on hidden divergence in ONE
convenient dashboard.
You no longer need to manually scan every pair and time-frame.
The dashboard does all the hard work for you.
With just one look at the dashboard, you'll instantly know
which trade setups has just formed on every pair and every
time-frame (from 1-minute to monthly)...
So...
Let our Hidden Divergence Dashboard indicator do all the heavy lifting for you...
First, it will scan ALL currency pairs and ALL time-frames for
the highest-probability trade setups based on Hidden Divergence you could ever find. And all these calculations
are done so fast - literally within seconds - you won't even notice
the time.
Second, the indicator will display a beautiful dashboard on your
chart where you can see exactly what trade setup has recently
formed on EVERY pair, EVERY time-frame.
Take a look below to see how cool it really is:
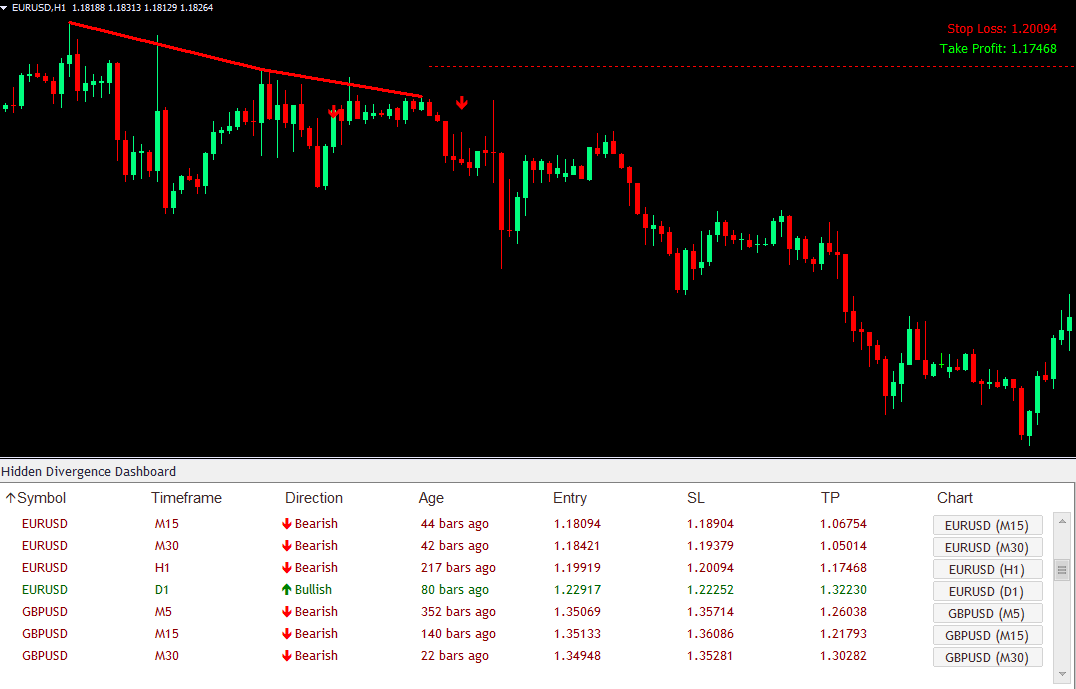
With just one look at the dashboard, you'll instantly know all
the information you need to make a good trading decision. You'll
instantly know which trade setup appears on every time-frame (from
1-minute to monthly) and on every currency pair.
Not only that, you'll also know the exact direction of that pattern
- whether it's bullish or bearish. And you'll know exactly how long
ago that particular setup showed up.
And you're in total control. You can specify which currency pairs
and which time-frame you want the indicator to scan for these
divergence trade setups:
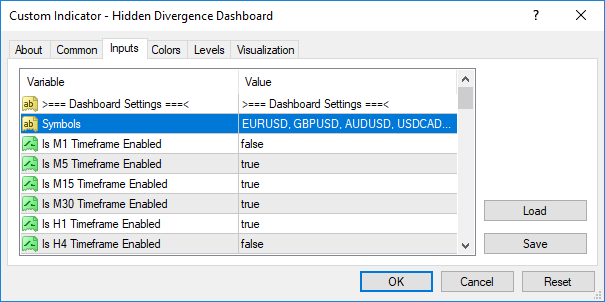
Remember, you can specify as many pairs as you like. You can also
use it for indices, stocks, futures, and gold (anything your broker
offers in Metatrader). Our Hidden Divergence Dashboard takes care of it
all.
Let me show you a short clip where I scroll through 10 currency
pairs (and all time-frames from 1-minute to monthly) and see all of
the divergence-based trade setups on my dashboard:
But maybe the most useful feature of the Hidden Divergence Dashboard
indicator is...
Click on the symbol you want, and the indicator will
open up that symbol's chart with the hidden divergence trade setup highlighted...
Take a look at this short clip to see what I mean:
That way, you can look at the dashboard first to see the overall
picture across multiple time-frames. Then once you identify a
pattern that you want to trade, just click on the symbol to open up
the relevant chart, so you can analyze the pattern further.
And by the way, did you know that...
You can sort the dashboard in any way you like --
based on Symbol, Timeframe, Direction, or Age...
Let me show you exactly how it works:

Pretty cool, isn't it?
Next... and here's where it gets REALLY interesting:
Hidden Divergence Dashboard is as close as it gets to a COMPLETE, AUTOMATED trading solution:
Here's why:
Once a trade entry is triggered, the Hidden Divergence Dashboard indicator will show you the best place to place your stop loss and take profit.
In other words, Hidden Divergence Dashboard gives you EVERYTHING on a silver platter: High-probability trade entry, stop loss, take profit...
It does all of the hard work for you. You no longer have to guess
when to enter or where to set your stop loss & take profit. Everything's
taken care of. You don't have to lift a finger.
By the way, it's very, very easy to trade with Hidden Divergence
Dashboard indicator because...
The indicator gives you all kinds of alerts:
Pop-up, Sound, Email, and Push Notifications as soon as a pattern appears...
So you'll never miss out on another important trade.
And my favorite part about Hidden Divergence Dashboard is that...
Since hidden divergence is a UNIVERSAL trading concept, and it works on
ANY timeframe and ANY currency pair (any financial instrument for
that matter)...
The Hidden Divergence Dashboard indicator works equally well for day
traders, swing traders, and long-term traders...
For example, if I were a day trader, I'd love this winning trade on the 15-minute timeframe:
Day Trading Example:

And if I were a swing trader, I'd love this winning trade on the 4-hour timeframe:
Swing Trading Example:
And if I were a long-term trader, I'd love this winning trade on the weekly timeframe:
Long-Term Trading Example:

But Hang On... We're Not Done...
Further down this page, you'll notice there are TWO purchase options you can
choose. You can get Hidden Divergence Dashboard indicator alone for an insanely generous
price I'm giving the first 200.
Or... you can invest a little more and get the Dashboard Pro package.
So What's Inside The
"Dashboard Pro" Package?
First off, you get the
Hidden Divergence Dashboard indicator.
And on top of that, you'll also get access to the ENTIRE collection of
ALL of our flagship DASHBOARD indicators. Including Divergence Dashboard, Harmonic Dashboard, Day Trading Dashboard, Wolfe Wave Dashboard, Candlestick Dashboard, and more.
To see the
full list of all indicators included in the Dashboard Pro package,
click
here...
And here's where it gets even better:
If you grab Hidden Divergence Dashboard TODAY,
you'll also get a BIG BONUS:
BIG BONUS: Hidden Divergence Pro Indicator
A perfect companion to Hidden Divergence Dashboard. Hidden Divergence Pro is perfect for you if you'd like to identify all the best HIDDEN divergence setups on a single currency pair.
Fast, lightweight, and efficient. This indicator will automatically detect all instances of hidden divergence for you.
Retail price: $99. But today you'll get it free when you invest in the Hidden Divergence Dashboard indicator.
Buy Now:
